
With 30% of U.S. office buildings, translated to a collective estimate of $1.1 trillion are at high risk of becoming obsolete, according to data from research analyst for Goldman Sachs, Randall Zisler, tenants aren’t taking any chances.
Professionals are being more careful than ever with their commercial real estate decisions… and this means assessing which of their locations are best positioned to survive and which states and regions have the highest likelihood of long-term success.
And when sourcing the national marketplace for data that may highlight any glaring warning signs, vacancy rate has been the traditional signifier thus far. However, when taking a deeper look into an area’s performance through its occupancy rate, a different story emerges.
Learn why an area’s vacancy rate is not the end-all-be-all for its long-term positioning in the leasing market.
Occupancy and Vacancy Relationship
Office vacancy rates indicate the percentage of space not rented in a given market, which has been a commonly used metric to assess the health and performance of the market. Vacant buildings are unoccupied and rent is not being paid.
However, an area’s vacancy rate alone does not fully accurately reflect the true demand for office space because since the WFH Movement and The Office Apocalypse, there is a new, gray market of underutilized space.

So, of course, vacancy rates provide valuable insights into the available office space, but the occupancy rate is a vital component to gaining a comprehensive understanding of the full scope of the market's dynamics in a hybrid-friendly environment. Because, unoccupied space becomes vacant space as soon as the lease expires.
| Consider the occupancy rate a dormant vacancy rate. |
The occupancy rate measures the percentage of office space that is actually being utilized and occupied by workers. Because companies have new standards for workplace productivity many businesses operate on hybrid schedules or have sent employees home indefinitely. This has dramatically disrupted their need for space, and existing leases do not account for the downsizing that'd widely taken place.

So, companies may be in existing leases but have made plans not to renew them or at the very least cut their square footage. So instead, following the conversation between occupancy and vacancy rates can give businesses a clearer projection of which areas poised for a new era of success, and which are on the brink of collapse.
Oddly, researchers have found a stark correlation between the two. Cities with the some of the highest observed vacancy rates also had the highest occupancy rates. At the same time, markets with the lowest vacancy rates also experienced lower than the average occupancy rates.
Note the chart below for a full run down on ten of the nation’s top markets. Notice any patterns?
Note for reference: Best-case scenario is when occupancies are high and vacancies are low.

Occupancy and Vacancy Trends
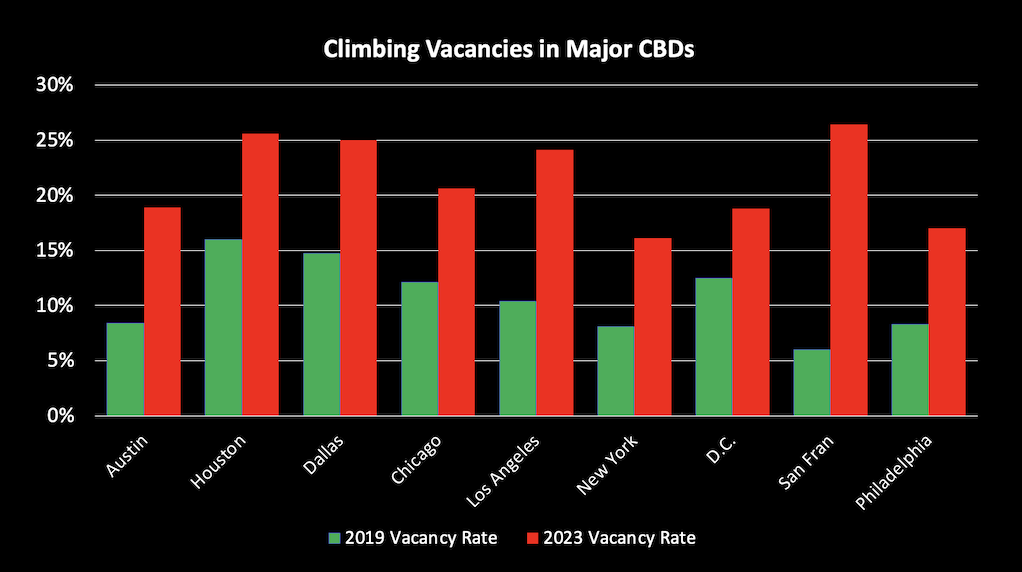
Keeping the above in mind, obviously some key trends emerge. First, and foremost, vacancies have reached never-before-seen levels throughout the country. Because we're not just dealing with recessionary symptoms like high interest rates and inflation, work from home has fundamentally shifted the need for office space. This is been reflected in a (almost) cataclysmic rise in the vacancy rate in our top metropolitan Central Business Districts (CBDs).
Consider the difference in the need for office space pre-pandemic, let's say 2019. Note how levels have climbed in the years since then.
Occupancy and Vacancy Trends Across Regions
While vacancy levels rose all around, the rate at which an area's vacancy rate has grown in conjunction with its occupancy rate will inform you which regions are poised for even more trouble.
Although the vacancy rates in NYC and Silicon Valley weren't as high as some of the other cities, their occupancy rates are under 50%. Yikes! This means that as those under-occupied leases come due in the next few years, the vacancy rate in those areas will explode to reflect the true, low demand for office space.
On the other hand, Texan cities Austin, Houston, and Dallas had considerably high office occupancy rates and high vacancy rates. (Learn more about The Top Cities in Texas for Business.) So even though the demand may seem low, the offices are populated and thus market is poised more for long-term success.
Why is this? Well, the nation’s Sunbelt has experienced a quicker and more robust return-to-office rate than Northern metros.
|
Coastal areas like San Francisco and New York City tended to take more time to return to the office and overall figures were lower. -Propmodo |
The office markets experiencing higher rates of success (in terms of occupancy and vacancy rates) are in the Mid-Atlantic and Southeast. These regions contain notable business-friendly states like Florida, Texas, and Tennessee.
Faster Return-to-Office in the South
This is perhaps due to several reasons that are not so coincidental. Due to the heavily embraced hybrid work model, employees have different expectations for if and when they do visit the office. As a result, there is new emphasis placed on premium office buildings with modern amenities. And where is there an abundance of these types of buildings for reasonable prices?

Austin, Texas
How about the nation’s new hubs of industry in the regions we mentioned? For instance, the Texas cities discussed above are widely becoming tech hotspots in place of Northern cities like NYC, San Fran, and Boston. Why? They’re less crowded, are associated with substantially lower taxes, and a more affordable cost of living.
In recent years, new interest has driven more developments, creating an overall more modern market, yet still associated with the reasonable costs of a not-yet-booming metro.
|
"More than 70% of office buildings in markets such as New York, San Francisco, Los Angeles, Boston, Chicago, and Philadelphia are at least three decades old." -CoStar |
People are more likely to return to offices they want to go to, with nicer amenities and located in safer neighborhoods. So rather than invest in locations in which they may be headquartered, companies are widening their geographic net and putting corporate dollars into areas where the power of the dollar goes further. Read why Citi bank chose an expansion in Tampa over NYC.
On the other hand, “In New York City, where many companies have their headquarters, close to 80 percent of companies have models where workers aren’t always in the office,” according to Propmodo.
And why aren’t employees wanting to go into the office in cities like New York…? Maybe the real question is why aren’t people willing to stay in cities like New York in general?

Given the freedom of remote flexibility, many Americans saw the opportunity to move out of crowded, expensive, crime-ridden environments, and took it. This goes hand-in-hand with why these areas are now struggling compared to the states that witnessed the largest population growth.
According to GlobeSt, “The Northeast and Pacific regions had larger concentrations of hard hit buildings and a slower return to offices than other areas, again as workers left crowded, expensive markets.”
Lower Cost Makes All the Difference
The other point to mention is that businesses in Southern environments are witnessing incredible cost-savings just by being located there. The rates for basic Class A office Space in New York City and San Francisco can be easily three times the cost of a Floridian or Texas office.
As a very real example, Citi Bank's 137,000 square foot campus in Tampa save the company over $50 million had they chosen to have the same square footage in Manhattan.

As a result, even companies that do have underutilized space there aren’t feeling the hurt as badly as tenants in New York, where one square footage of wasted space averages for $80.
Balancing Occupancy and Vacancy Performance
Understanding the relationship between occupancy and vacancy rates provides valuable insights for businesses seeking to make informed decisions about their office space.
By considering the interplay between the two, a more comprehensive understanding of the market dynamics emerges, offering a clearer projection of areas poised for success or potential decline.
And when deciding what location would best serve any long-term CRE investments, occupancy rates should not be overlooked. High occupancy rates are often indicative of market stability and long-term viability. They suggest that businesses are choosing to remain in the area, potentially due to favorable economic conditions, access to talent pools, infrastructure, or industry-specific advantages. A location with consistently high occupancy rates is more likely to offer a stable and reliable environment for businesses to establish their operations.
But occupancy rates are only one element to consider when looking for a new location for office space. If you're a commercial tenant looking for new space, you have immense power if you know what you're looking for and how to navigate the market dynamics. So stay on top and subscribe to our blog to learn the latest.
Wondering where to begin?
Related Content


Subscribe to Our Learning Center

